
Automated options trading is often presented as a straightforward advantage: define the rules, remove emotion, and let the system execute consistently.
In practice, automation can expose weaknesses just as efficiently as it enforces good decisions. Strategies that looked solid in testing can break down, drawdowns can become larger than expected, and several seemingly small positions can combine into much more risk than the trader intended.
The Biggest Reasons Automated Options Strategies Fail
Many automation failures have less to do with finding the “wrong” indicator and more to do with how risk accumulates across the entire system.
1. Overlapping Positions and Hidden Portfolio Risk
This is one of the most common – and most underestimated – problems in automated options trading.
When systems open multiple trades based on similar conditions, those positions often carry the same underlying risk. Several trades may appear diversified on the surface, but if they depend on similar market behavior, they can move against the portfolio at the same time.
Automation makes this easier to overlook because it removes hesitation. If the rules say to enter, the system continues entering unless another rule tells it not to.
- Stacked positions in the same direction
- Hidden correlation across different tickers
- Compounding losses during adverse moves
- Drawdowns that are disproportionate to each individual trade’s size
What appears to be a series of small, defined-risk trades can behave like one large position when markets move quickly.
2. No Defined Risk Framework
Many automated strategies define entry and exit rules but fail to define portfolio-level risk.
Without broader limits, a system may continue opening trades while exposure is already elevated, allocate too much capital to similar strategies, or fail to account for correlation among positions.
This is why automated systems need limits that operate above the individual trade level. For a deeper look at these controls, see trading bot risk management and how to prevent automated strategy blowups.
3. Poor Entry Timing and Volatility Clustering
Markets tend to move in clusters. Volatility expands and contracts in waves, and trends can persist longer than expected.
An automated system that enters repeatedly without spacing or filtering can unintentionally concentrate positions during the same market environment.
The result is timing risk at the portfolio level even though each individual trade technically followed its rules.
4. Letting Trades Run to Expiration Without Management
Opening a position automatically is only half of an automated strategy. The system also needs explicit rules for what happens after entry.
Holding positions to expiration without deliberate management can increase exposure to late-stage risk, particularly when several trades are open simultaneously.
- Unfavorable price movement close to expiration
- Missed opportunities to realize profits earlier
- Increasing sensitivity to rapid underlying-price changes
- Positions drifting into outcomes that were never part of the original plan
Exit logic should be part of the strategy before the trade is opened. See how to set up automated exit strategies for a more detailed framework.
5. Over-Optimized Backtests
Backtesting is useful, but it can also create false confidence when a strategy is repeatedly adjusted until it fits historical data exceptionally well.
Small changes in thresholds, dates, indicators, or other parameters can sometimes produce dramatic differences in historical results. A strategy that depends on one highly specific combination of settings may be capturing quirks in the historical sample rather than a durable trading behavior.
What Actually Works: A Practical Framework
A more durable approach to automated options trading focuses on structure rather than prediction. Instead of depending on perfect signals, the system controls how trades accumulate, how much exposure is permitted, and how positions are managed.
Space Entries Over Time
Spreading entries across different days reduces clustering risk and exposes the strategy to a wider range of market conditions. It does not eliminate correlation, but it can prevent a system from deploying a large portion of its risk budget during a single market moment.
Limit Concurrent Positions
A cap on open positions prevents automation from continuing to add exposure indefinitely. The appropriate limit depends on position size, strategy design, account size, and how correlated the trades are.
Mix Expiration Cycles
Using different durations – for example, combining 30–45 DTE positions with shorter-duration trades – can distribute timing risk rather than concentrating every position around the same expiration cycle.
Define Profit-Taking and Exit Rules
A structured system determines in advance when profits can be realized, when losses require action, and when a position should be closed before expiration.
These are not universal percentages. They are strategy variables that should be evaluated as part of the complete system.
Think in Terms of Total Portfolio Exposure
The most important shift is moving from “How risky is this trade?” to “What happens to the portfolio if these trades are wrong at the same time?”
That question captures correlation, overlapping strategies, directional concentration, position count, and total capital at risk.
An Example of a Simple Structured System
Here’s an example of how these concepts can be translated into concrete rules:
- Focus on 30–45 DTE defined-risk trades
- Spread entries across multiple days
- Use a mix of less-correlated tickers
- Limit the number of concurrent positions
- Use a defined profit-taking rule
- Manage positions before expiration
The objective is not to predict the perfect entry. It is to create a structure in which no single decision, market condition, or cluster of trades is allowed to dominate the entire system.
Want to put structured trade management into practice? The automation platform we use and recommend lets options traders build bots around predefined entry, position-management, profit-taking, stop-loss, and expiration-based rules.
A Real-World Example of Structured Automation
To see how this can look in practice, consider results from a live automated system that had been running since July 30, 2024, with each position capped at $500 in total risk.
The system focused on 30–45 DTE defined-risk trades across multiple tickers, with consistent sizing and a roughly 45% profit target.
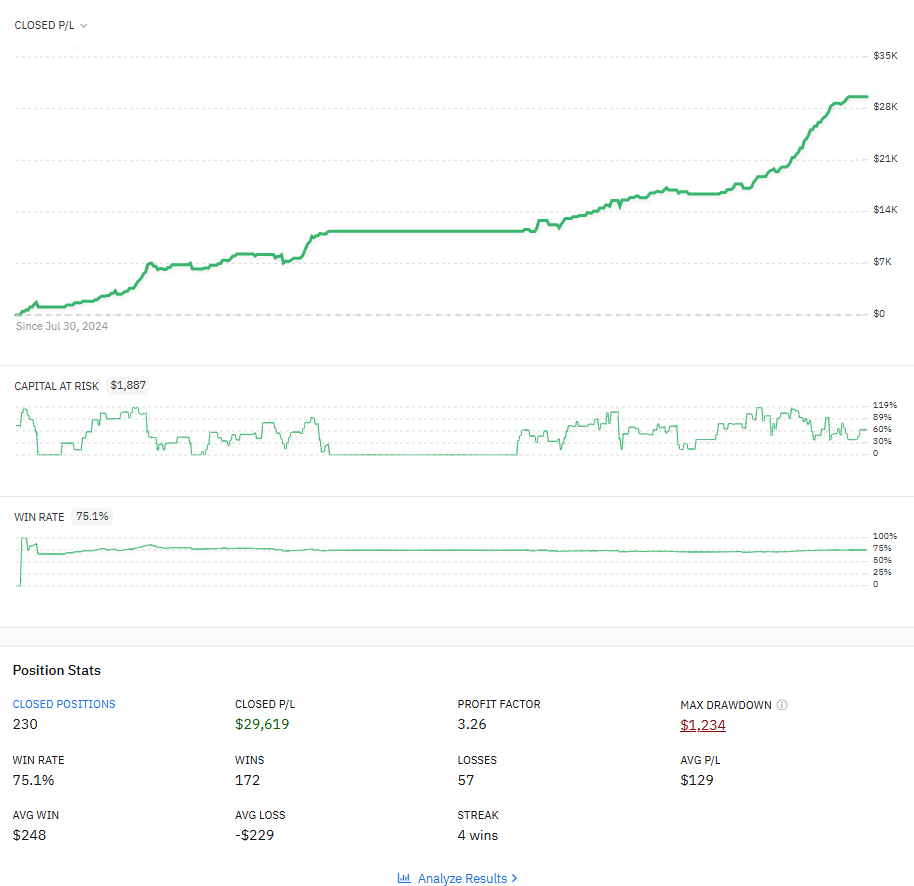
Across those 230 closed positions, the system recorded 172 wins and 57 losses. The average winning trade was $248, while the average losing trade was -$229.
+$248
−$229
The useful lesson is not simply the headline P/L or win rate. The system combined consistent sizing, limits on overlapping exposure, trade distribution, and repeatable management rules.
What to Measure Beyond Win Rate
A high win rate can look impressive while hiding an unfavorable relationship between winning and losing trades. Evaluating an automated strategy therefore requires more than counting how often it wins.
A trade journal can make this analysis easier by aggregating results across many positions instead of relying on memory or individual winners and losers.
TraderSync can help organize trading history and analyze metrics such as performance, trade patterns, and results over time – useful when evaluating whether an automated strategy is behaving the way its rules intended.
Key Takeaways
Final Thoughts
Automating an options strategy does not remove the need for disciplined risk management. In many cases, it makes good structure even more important because the system can execute repeatedly without the hesitation that might otherwise slow a human trader down.
A durable automation framework considers entries, exits, position sizing, trade spacing, correlation, concurrent exposure, and portfolio-level risk together.
The goal is not to automate more trades. It is to automate a process that remains controlled when several trades, strategies, and market conditions interact at the same time.