
Technical analysis has long been the foundation of trading decisions, helping traders identify opportunities and manage risk using price action and momentum. But as markets move faster and data becomes more complex, automation is changing how traders apply these signals.
Modern automated trading systems use technical indicators to make consistent, rules-based decisions that reduce emotional interference. Indicators such as RSI, MACD, and moving averages can become objective conditions that a system can monitor and act on consistently.
Why Combine Technical Analysis and Automation?
Human traders often struggle with timing and discipline. Even with a solid understanding of indicators like RSI or MACD, execution can falter under pressure.
Automated trading addresses that problem by executing trades when market conditions match a predefined set of rules.
RSI: Defining Momentum Automatically
The Relative Strength Index (RSI) measures momentum – how quickly and strongly prices move up or down – on a scale from 0 to 100.
In manual trading, a reading above 70 might indicate overbought conditions, while a reading below 30 suggests oversold territory. Automation takes the concept a step further by converting those observations into explicit conditions.
- Trigger a buy condition when RSI falls below a specified threshold, such as 35
- Sell or hedge when RSI rises above a specified limit, such as 65
- Adjust thresholds based on volatility or timeframe
Instead of waiting for a trader to notice the condition and decide how to react, the system can continuously monitor the indicator and apply the predefined rule.
MACD: Spotting Trend Shifts
The Moving Average Convergence Divergence (MACD) helps identify changes in momentum. It compares moving averages and can generate a signal when the MACD line crosses its signal line.
For a human trader, that can require visual confirmation followed by a quick decision. With automation, the crossover itself can become part of the trading logic.
MACD crosses above its signal line.
MACD crosses below its signal line.
Add filters such as volume or RSI to reduce false signals.
Once MACD rules are defined, they can also be tested across historical data before real capital is placed at risk.
Moving Averages: The Foundation of Automated Filters
Simple and exponential moving averages (MA and EMA) are building blocks for many rule-based trading systems.
Automated strategies can use moving averages to define trends, confirm entries, or filter trades:
Moving-average conditions can also support trend-following or mean-reversion systems that adjust position size or risk controls based on how far price has moved from an important average.
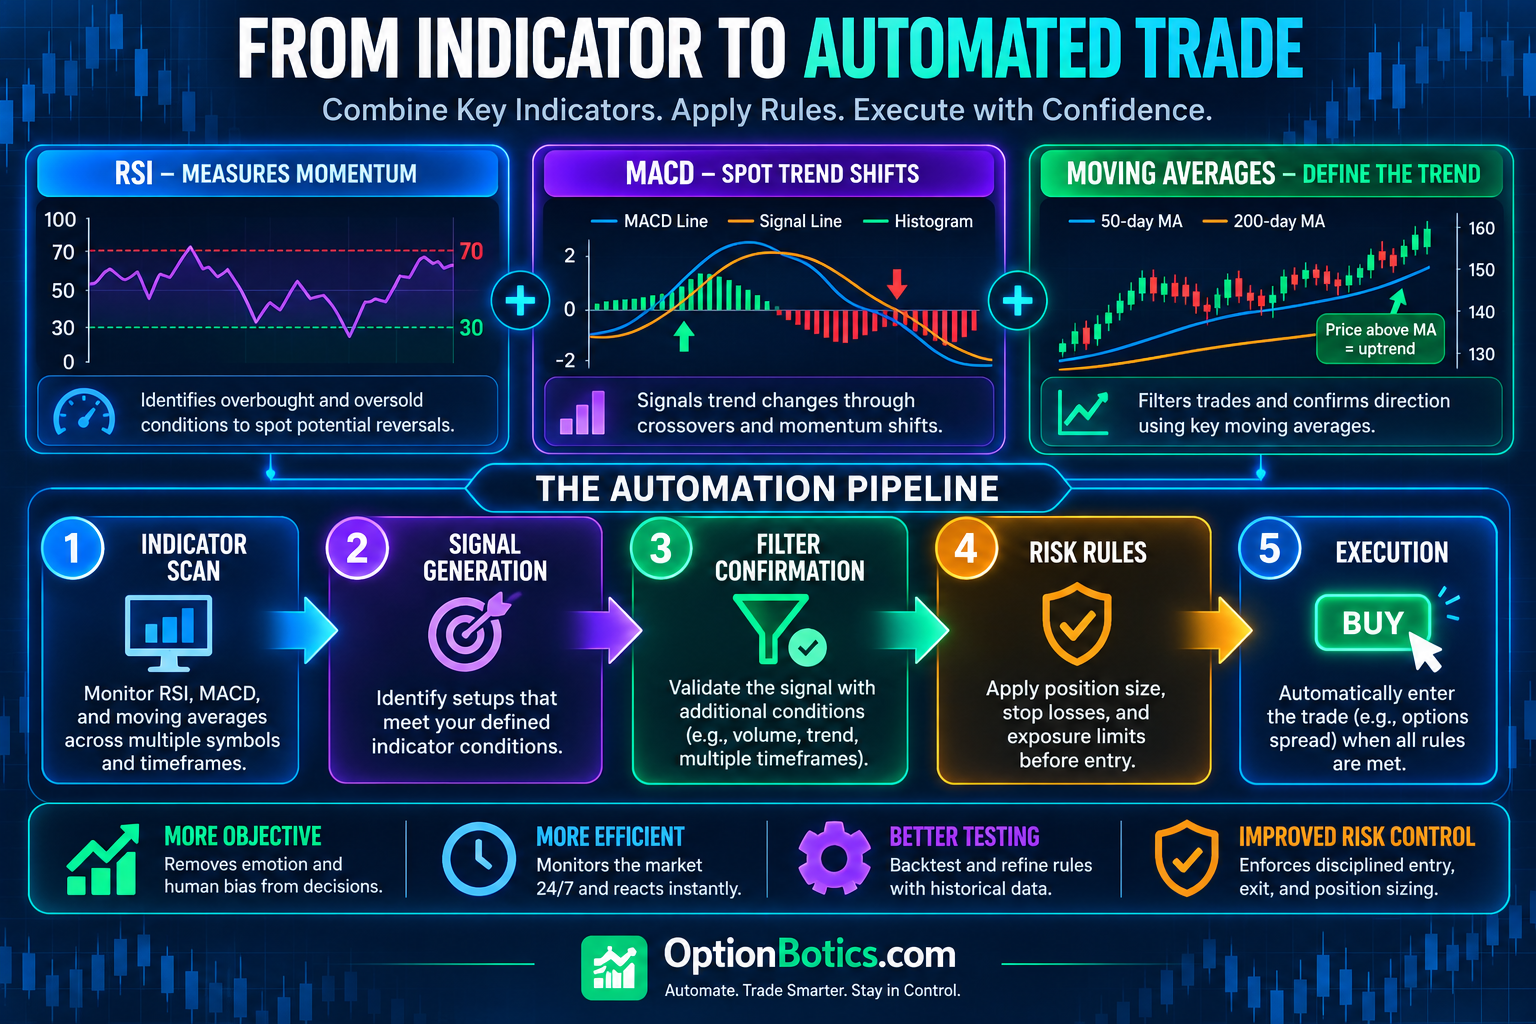
Creating a Complete Automated Strategy
When traders use RSI, MACD, and moving averages together, they can create a multi-layered confirmation system. Automation ties those conditions together into a repeatable process.
The result is a technical-analysis process that can be tested, refined, and executed more consistently.
Why This Matters for Options Traders
Technical indicators aren’t limited to stock trading. The same conditions can become inputs for automated options strategies such as credit spreads, iron condors, or directional calls.
An options strategy could combine multiple conditions:
Those are no longer subjective chart observations. Once each condition is precisely defined, they become executable strategy logic.
Bringing It All Together
The intersection of technical analysis and automation gives traders a way to turn familiar market indicators into structured trading rules.
Indicators provide the signal. Rules define how that signal should be interpreted. Automation provides consistent execution.
If you’re exploring how automation can enhance an options trading strategy, continue exploring the strategies and tools on OptionBotics.com to learn how rule-based systems can be built, tested, and managed.